
Appearance
Grouping
A thousand occurrences of one bug should be one row you can act on, not a thousand rows you page past. Occurrences are grouped into issues by a fingerprint built from four things:
- Side — client or server.
- Error type —
TypeError,RangeError, and so on. - The normalised message.
- The topmost stack frame that belongs to your application.
Why the message is normalised
A message usually carries the very thing that differs between occurrences:
User 41827 not found
User 90113 not found
Grouped literally, those are two issues; after a busy day, thousands. So volatile fragments are replaced before hashing:
| In the message | Becomes |
|---|---|
550e8400-e29b-41d4-a716-446655440000 | <uuid> |
| A hex run of 16 characters or more | <hash> |
'anything quoted' or "anything quoted" | <str> |
| A bare number | <n> |
Both messages above normalise to User <n> not found and land in one issue.
Each occurrence keeps its own text, so the issue page still shows you the real ids. Before that was true, every occurrence borrowed the issue's message — the most recent one — and all 250 rows showed the same id.
Why the frame must be yours
The same bug surfaces through different library frames depending on the call path. Grouping on the topmost frame of all would scatter one fault across many issues, keyed by whichever internal function happened to be on the stack.
So frames inside node_modules, node:internal, the Nuxt and Vue runtimes, and Nitro's chunks are skipped, and the first frame in your own code is used.
When grouping is wrong
Too coarse — distinct faults collapsing into one issue. Usually two different errors with the same generic message thrown from the same helper. The fix is a more specific message.
Too fine — one fault spread across many issues. Usually a message carrying something normalisation does not recognise, like failed for widget kx91#a. Move the variable part out of the message and into context.
That second case is worth watching for, because it is the axis along which the database actually grows: every occurrence gets its own fingerprint, so 20,000 such errors become 20,000 issues. maxIssues and maxDatabaseMb bound it — see Storage.
What a grouped issue tells you
Once occurrences are one issue, they can be counted against what they share — browser, browser version, OS, OS version, device, release, route and session.
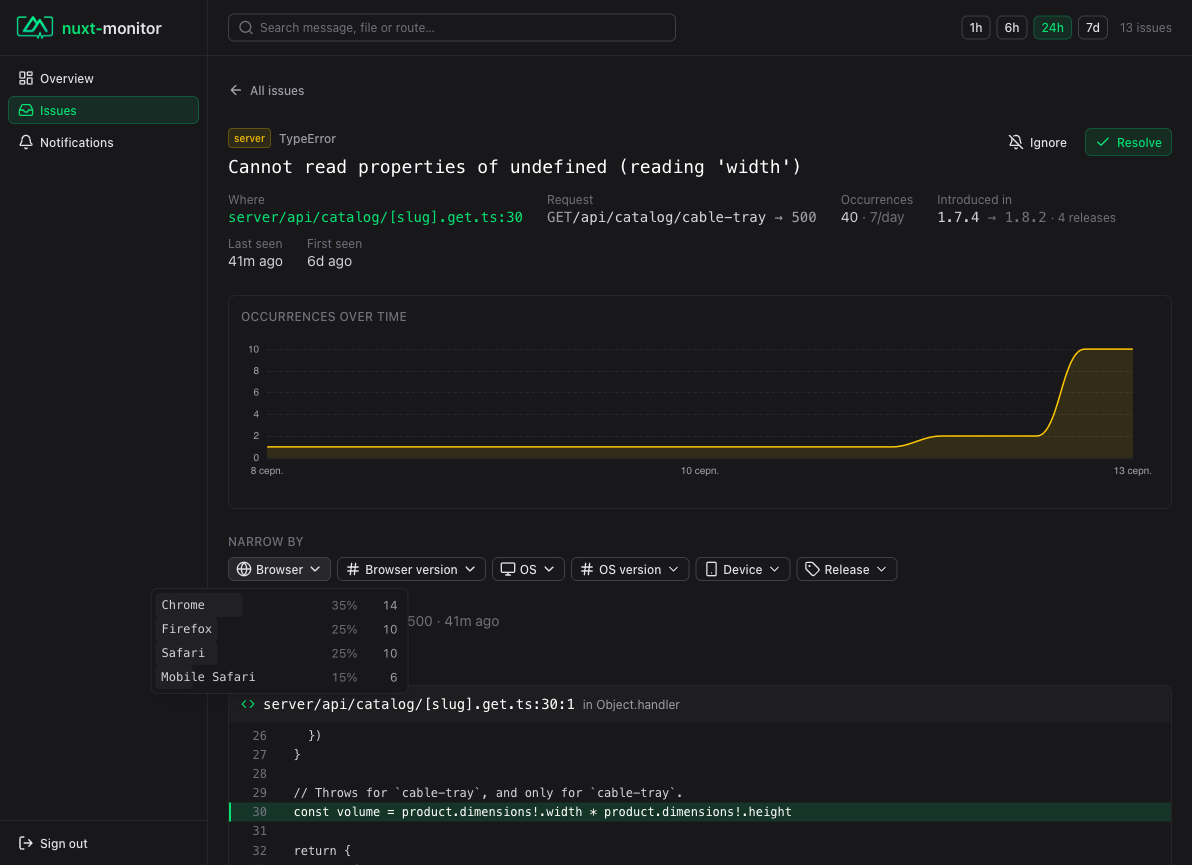
"250 errors" is a number; "250 errors, all Safari 16" is a diagnosis. Clicking a slice filters the occurrences below it.
Endpoints, pages and assets
Every issue is classified as api, page or asset, and the issue list's type filter offers the first two.
This exists because side — server or client — stops being the useful split as soon as an application has both. /api/orders returning 500 to every consumer and /checkout failing to render for one visitor are both "a server error", and they are not the same problem: usually different owners, different urgency, different fix. One is an integration; the other is a page.
The path is checked first — /api/…, /graphql, Nitro's /_… routes — and then the Accept header, which is the reliable signal for an application that mounts its endpoints somewhere else: a browser navigating asks for text/html, $fetch and a mobile client do not.
Assets are their own kind rather than being forced into one of the other two: a missing image is not an endpoint failure and not a page failure.
Type and origin — server, browser, reported by hand — are separate filters rather than one list of choices, because they answer different questions and combine: an error thrown while rendering a page during SSR is genuinely both a page failure and a server one, and "open API failures on the server" is a question somebody actually asks.
Judged against the traffic, not against other errors
An issue card leads with one sentence — 90% on Mobile Safari 15 — and that sentence is only worth reading if it is measured against the right thing.
The module counts what the traffic looks like: browser, version, OS and device of every page view, as counters with no route, no path and nothing identifying. A slice has to be over-represented against that before it is mentioned.
The difference is the whole feature. Measured against the facets of other errors, "90% of these are on Chrome" is confirmed by whichever browser is noisiest and says nothing about this issue. Measured against an audience that is 90% Chrome, the same number is a tautology — and 90% on a browser that is a tenth of your traffic is a finding.
Page views only. One page drags a dozen $fetch calls behind it, and counting those would weight a visitor by how chatty the page is rather than by being one visitor. Releases are not counted either: a release describes the build serving the page, not the person reading it, so counting it would make every previous release look like an audience that vanished on deploy.
With no page views counted yet — a fresh install, or an API-only application — the comparison falls back to the error facets. Weaker, but better than ranking slices by share alone, which has no notion of over-representation at all.
Resolving
Marking an issue resolved hides it from the default view. If it happens again, it reopens automatically — a resolved issue that recurs is not resolved.